Diagrams, graphs and maps are visual texts that are fundamental to Geography. The construction of visual representations of geographical concepts and relationships supports students' developing understanding because they provide an easy-to-process structure to retrieve, and show, their knowledge (Vekiri, 2002). In addition to being able to construct these visual texts, students should be able to annotate them. Annotations provide additional information that explains, elaborates on, or emphasises the visual elements of a diagram, graph or map.
Note: Strategies on how to explicitly teach the semiotic (meaning-making) systems of visual texts in Science can be found on the
Reading and explaining visual scientific images web page. Teachers can adapt these strategies for the Geography classroom.
Teachers can support students to annotate their visual representations in Geography through guiding construction, either as a class or in small groups.
Note: Other strategies that may assist students to draw geographical visual representations may be adapted from
the Science section of the toolkit.
- Teacher provides students with a visual representation.
- Teacher leads a class discussion to unpack and interpret the visual representation.
- The teacher points to various sections of the visual representation and asks students to describe or elaborate on what that section is showing.
- The teacher annotates the visual representation with the students' responses.
- Once the visual representation has been annotated, the teacher leads a second discussion to revise and edit the annotations. Possible questions to ask include:
- Is this description accurate?
- Are nouns used to name the features being named?
- Are adjectives used to describe the nouns?
- Are verbs used to explain the process being annotated?
- Are adverbs used to describe the verbs?
- Could we write this annotation more succinctly?
- Is it clear to which part of the visual representation the annotation refers? How could we make it clearer?
- Students copy the revised annotations in their notes.
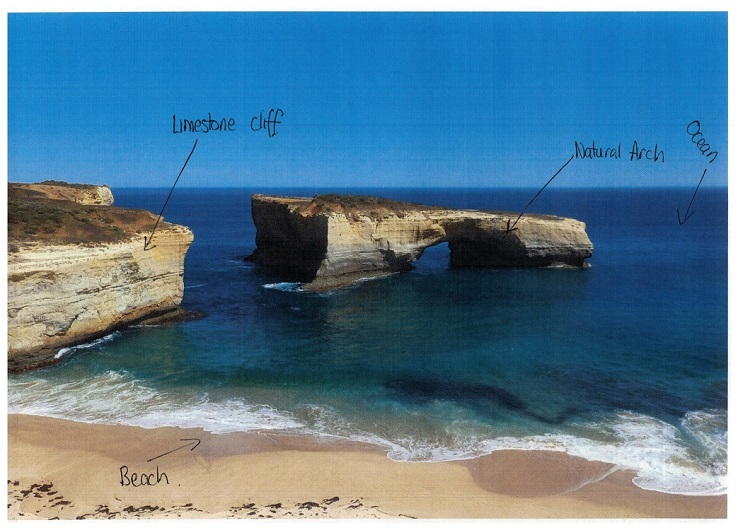
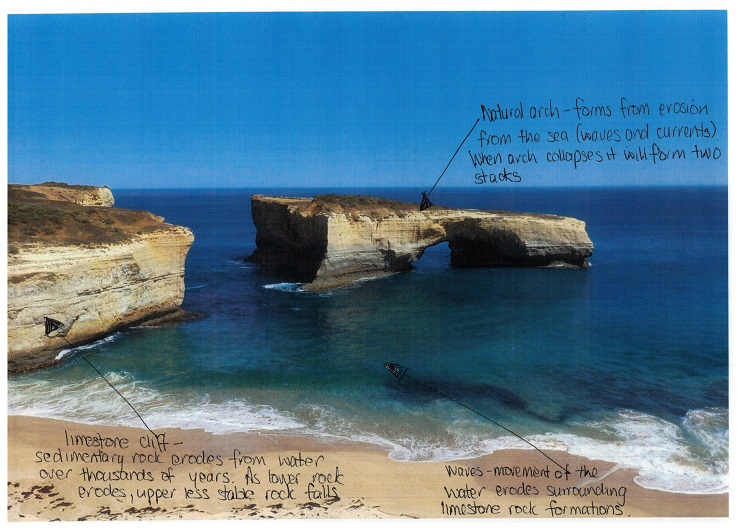
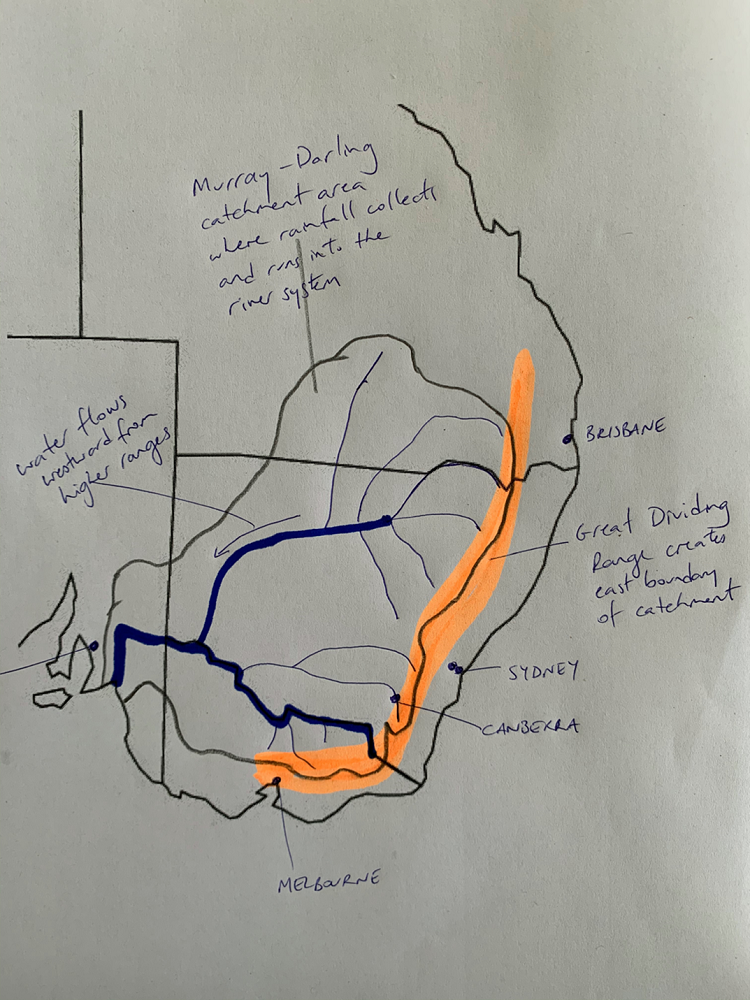
Below are two examples of annotated visual representations in Geography that were constructed with a class. The first image in each example shows the visual text the teacher initially showed the students. The second image shows the jointly constructed annotations.