Scientists do not only use words but also diagrams, graphs and images to convey their knowledge. In other words, they communicate through a complex combination of semiotic (meaning-making) systems to generate multimodal texts (Polias, 2016).
Students need to be able to both understand these visual representations and to create their own. The creation of these representations provides a way for students to play with their emerging ideas, build and extend existing knowledge while also learning appropriate visual conventions (Ainsworth, Prain & Tytler, 2011).
The process of drawing diagrams as well as explaining and justifying them assists students to develop science understanding (Waldrip, Prain & Carolan, 2010). The generation of visual representations should thus be thought of as a thinking tool that both develops and shows student understanding. Research has shown that the use of workbooks that are lined on one side and blank on the other not only encourage students to use drawing to explore and present ideas, but also improve student engagement with learning (Tytler, Prain & Hubber, 2018).
Four strategies to support students to draw visual representations of their scientific knowledge are:
- critiquing and creating diagrams
- joint construction of diagrams
- writing and drawing chemical reactions
-
transforming data
There is also a note about the use of concept maps.
Critiquing and creating diagrams
Within Science, students are presented with a range of diagrams and models that represent abstract and complex processes. Teaching students the skills to critique visual and physical representations in Science empowers them to identify positive and productive aspects that they can then incorporate into their own diagrammatic representations.
The following activity has been adapted from Tytler, Prain and Hubber (2018), and focuses on the rock cycle that is taught in Year 7 or 8 (VCSSU102). One visual representation of the rock cycle that can be used is also below.
This strategy can be adapted to support learning related to any of the Science Understanding content descriptions.
- Present students with 5–7 visual representations of the rock cycle.
- In groups of three or four, students critique the different diagrammatic forms. For example, they could:
- note features that they find helpful or confusing
- write down what is shown well and what is not shown well.
- The teacher supports the students’ critique by asking question to elicit more specific responses (for example, “What do you mean by ‘everything’?”; “What do you like about how the sedimentation process is drawn?”)
- Students construct their own representation of the rock cycle.
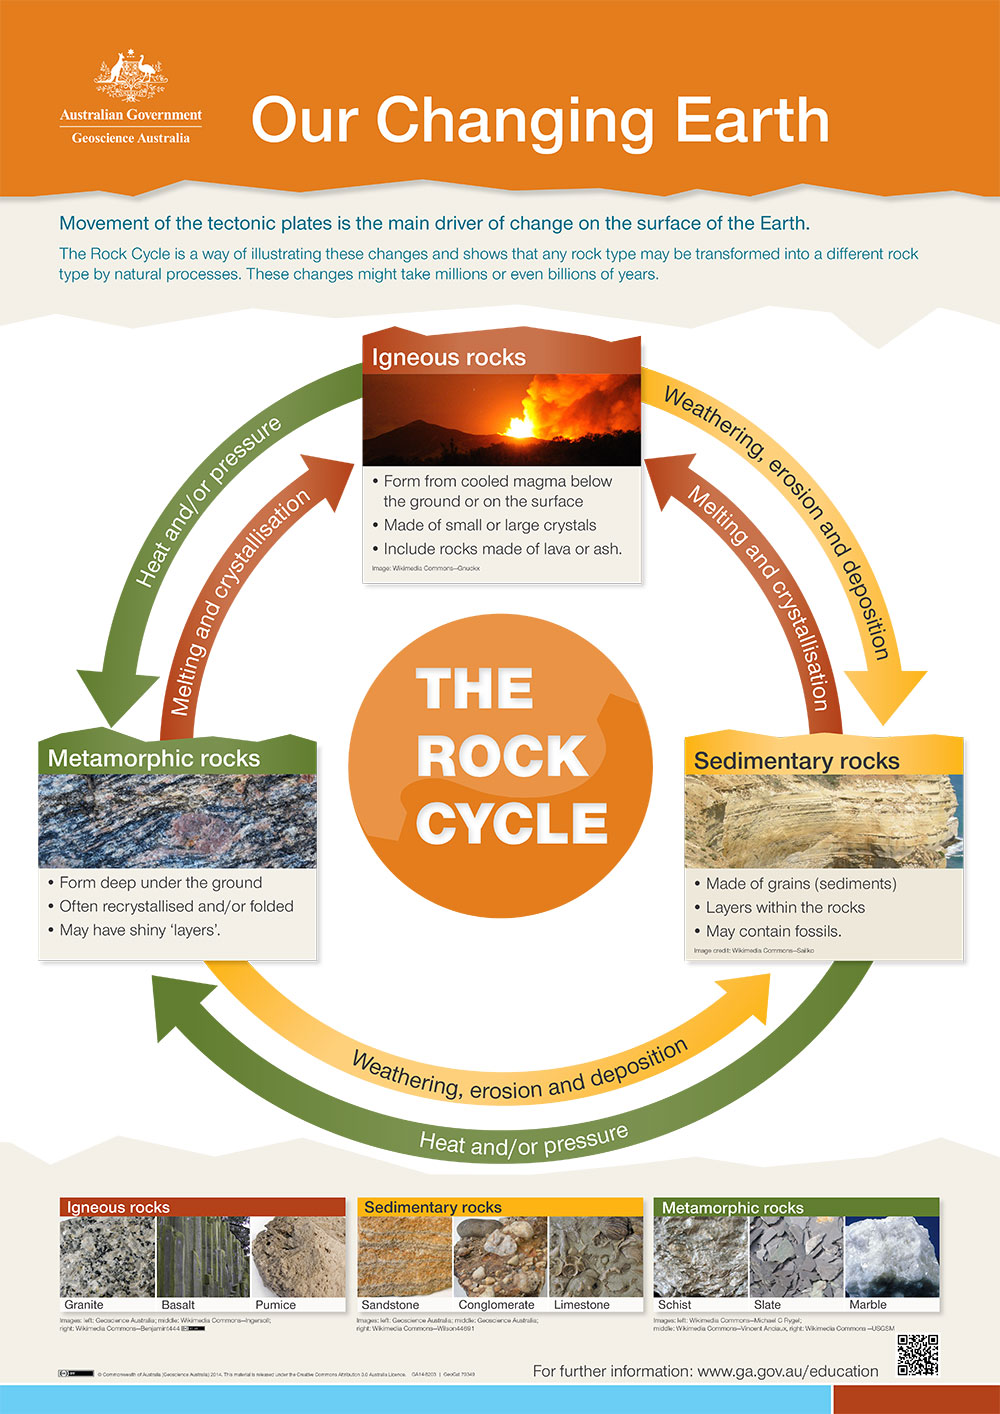
Source:
Our changing earth: The rock cycle, Commonwealth of Australia (Geoscience Australia), 2014.
Joint construction of diagrams
Joint construction is a collaborative learning activity that provides opportunities for the teacher and students to share their knowledge and learn from one another (HITS Strategy 5). Joint construction can be used to support students to develop their literate skills to draw visual representations of knowledge.
- Provide students with a written definition of a process.
- Have students discuss the definition in pairs.
- Ask students to draw a diagram to represent the process.
- Students explain their diagram to the class.
- Students receive feedback from their peers and teacher about their diagram.
- Students are given the opportunity to act on the feedback to refine their diagram.
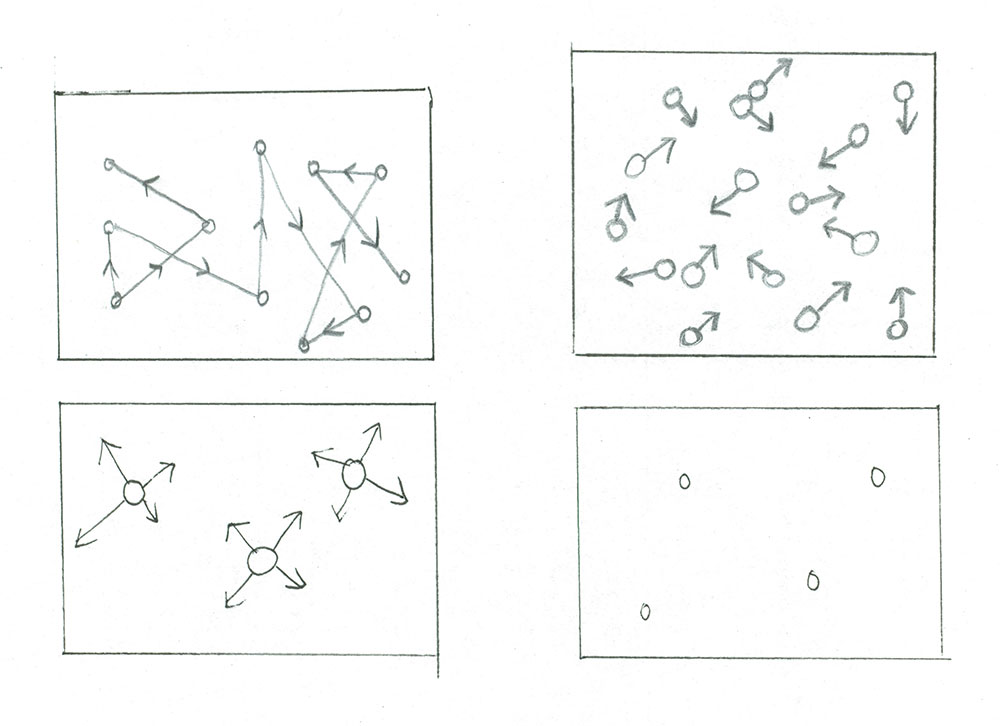
The images below are drawings made by Year 7 students to show the relationship between Brownian motion and changes of state (VCSSU096,
VCSIS110).
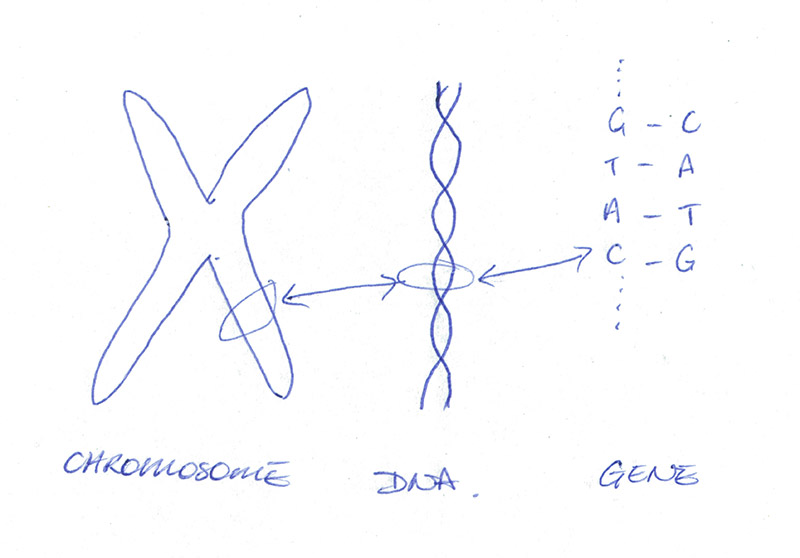
The image below is a drawing made by a Year 10 student to show the relationship between chromosomes, DNA and genes (VCSSU119,
VCSIS137).
Writing and drawing chemical reactions
A chemical formula is a remarkably short and reduced mode of representation (Taasoobshirazi & Glynn, 2009). While chemical formulas enable efficient communication between scientists, they set up comprehension barriers for students (Taasoobshirazi & Glynn, 2009).
Helping students to move between modes of representation of chemical formulas should assist them to develop both their comprehension of the meaning-making system of chemistry, but also of the chemistry involved in the represented chemical reactions.
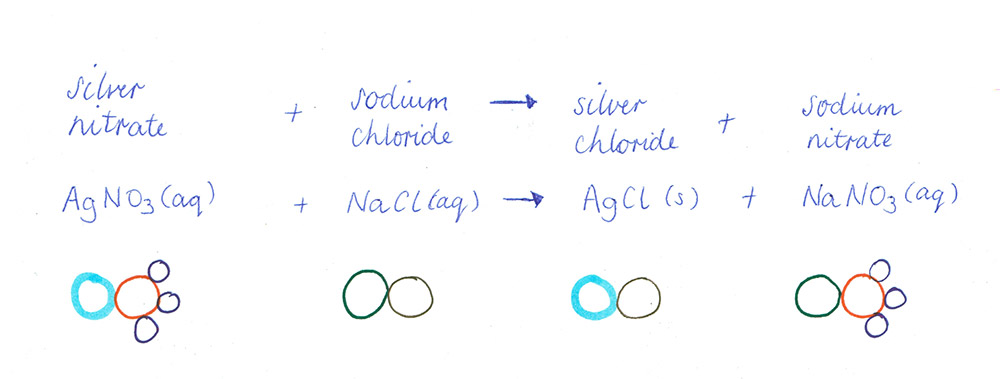
The example below can be used in a Year 9 or 10 class (VCSSU124,
VCSIS137). The following student sample is from a Year 9 class.
- The teacher or student writes the chemical reaction in words.
- With assistance, the students write down the chemical formula for the reactants and products.
- The students draw molecular diagrams of the reactants and products.
- The students balance the chemical equation by drawing additional molecular diagrams for the reactants and products.
- Once the drawings are balanced, the students count the molecules on each side of the reaction and balance the chemical reaction.
- Students can rewrite the chemical reaction in words, adding in the number of molecules of each reactant and product.
In the first part of this video, Emily Rochette demonstrates how teachers can assist students to move between various representations of chemical reactions. After observing several chemical reactions, students are supported to transcribe written chemical reactions into chemical equations and molecular diagrams.
Literacy in Practice Video: Science - Diagrams
In the second part of the video, Emily discusses the importance of drawing diagrams in Science. She emphasises the features of scientific drawings (as opposed to everyday drawings) to better develop her students’ drawing skills.
Student prompts
- What have your teachers done to support your drawing skills in Science?
- What do you understand to be the difference between everyday drawings and scientific drawings?
- How might drawing chemical reactions help you to understand how chemicals react?
Read the
in-depth notes for this video.
Transforming data
In Science, data and concepts are represented in multiple modes (forms of communication). As well as using written language, scientists use images, graphs, diagrams, and models, to name a few.
Different modes of communication present information in different ways, and not any one mode can give you a complete meaning. In other words, each mode of communication has benefits and constraints.
Transforming, or transducing, content into different forms can be challenging for students because some meaning might be gained or lost when moving between modes (Jakobson et al., 2018). Students require support to transform data because changing the mode in which information is presented requires both the form (structure) and content to be altered (Jakobson et al., 2018).
Assisting students to transform data from one form to another:
- improves their literacy skills in Science
- helps them to understand the benefits and limitations of different forms of representation (or modal affordance)
- helps them to develop and write explanations for their observations.
Literacy in Science Video: Explained
In this video, Dr Emily Rochette discusses some of the literacy challenges associated with learning in Science. These include representing scientific concepts or phenomena, whether orally, in writing or through diagrams, and writing a range of text types, particularly in relation to practical activities. Dr Rochette suggests it is important for teachers to model how to incorporate scientific representations into written responses.
Teacher prompts
- How do you support your students to make meaningful links between the microscopic, macroscopic and symbolic levels of representation in chemistry?
- How do you model writing each section of a practical report in chemistry?
Audio transcript
[gentle music]
[Dr Emily Rochette ] So one of the challenges in chemistry is helping students to make the connections between the macroscopic, the microscopic, and the symbolic levels of representations.
For example, when we teach balancing chemical reactions in junior chemistry, students right away are presented with a symbolic representation of these substances, and they need to be able to account for how these substances are changing in chemical reactions.
So what we do is we try to represent these chemical formulae in terms of particle models of the atom.
We use tables in order to account for what's happening to the individual atoms and how they're being rearranged in order to help students be able to articulate what's happening at the microscopic level.
And this becomes quite challenging because not only do students have to do this orally, they also have to do this through writing, and whether that means representing different substances through pictures, but also using the scientific terminology in longer written responses.
Things like this become quite complicated when they're incorporated into practical work, for example, because there are many different text types that are presented in practical work.
For example, creating a procedure or a method with a step-wise way of doing things and interpreting the science, things like this.
But also one particular area that's quite difficult for students in practical work is the discussion where they need to display their understanding of these three different representations.
So practising that a lot during class time through discussion, through written responses, and in particular using students' responses that might be unsophisticated from a scientific level, showing them in class and modelling the correct use of this terminology becomes very, very important.
[gentle music]
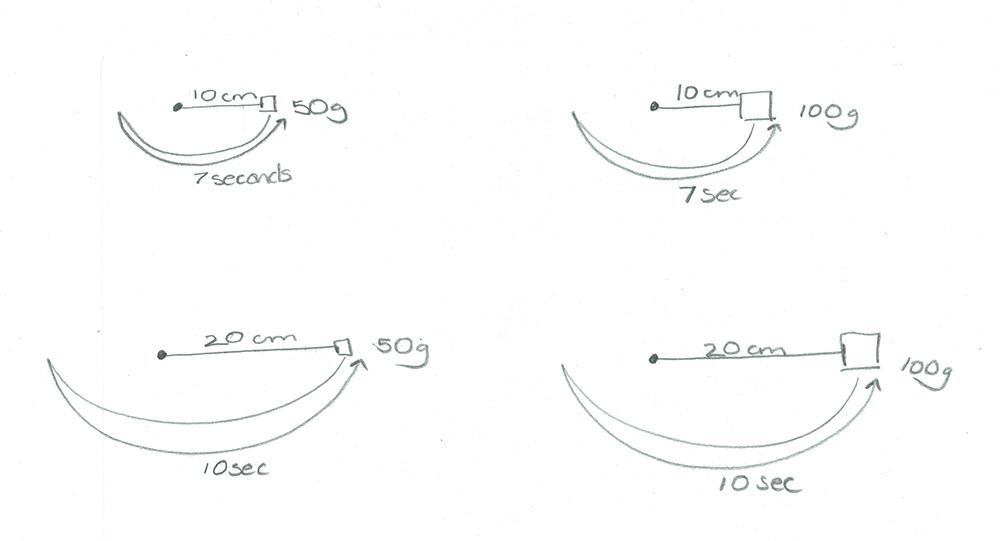
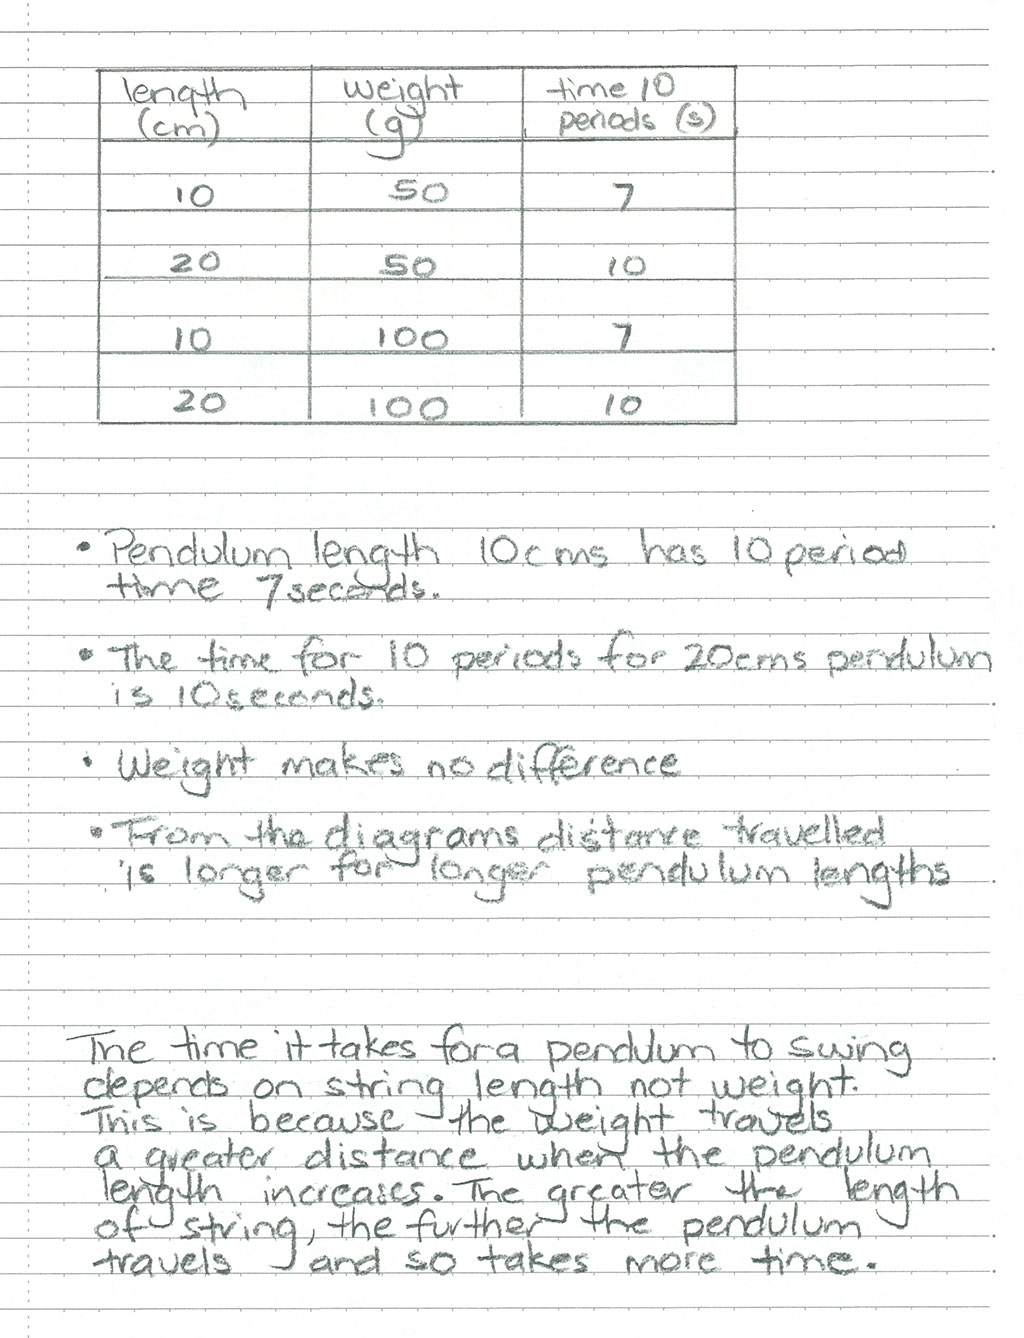
The following activity, and student sample, comes from a Year 10 class (VCSSU133,
VCSIS137,
VCSIS138), and has been adapted from Jacobson et al. (2018). While the end-product of this strategy is for students to write an explanation for their observations, the strategy can be adapted to focus on developing students’ ability to represent scientific data in any mode.
- Students perform an experiment (e.g. measuring period time of a pendulum swing).
- Students draw a diagram to represent their observations (e.g. 2-dimensional diagram of pendulum swing, including pendulum length, weight and measured time).
- Students transform the diagram into a table format (e.g. 3-column table recording “length”, “weight” and “time for 10 periods”).
- Students analyse their table to write a list of generalisations about their observations.
- Students review their bullet list and rewrite their generalisations in running text form. Make sure students use connectives and causal links (see expressing cause and effect).
View full size image of student pendulum explanation - jpg 768kb
A note about concept maps
A concept map is a visual representation that shows relationships between and among objects, words, or ideas. The use of concept maps is a metacognitive strategy (HITS Strategy 9).
Fisher, Frey and Hattie (2016) suggest that the use of concept mapping is most effective when it is used as a tool for students to show their thinking and to organise what they know. In other words, a concept map should not be considered an end-product; rather, it is an intermediate step that students can use to complete another task (Fisher, Frey & Hattie 2016, p. 80).
Concept maps could have been used to support student thinking in any of the strategies outlined in the other sections. For example, for critiquing and constructing diagrams, students could have used a concept map to take notes of the various posters they observed. They could then use their concept map to help construct their individual diagram.
References
Ainsworth, S., Prain, V., & Tytler, R. (2011). Drawing to Learn in Science. Science, 333(6046), 1096–1097.
Fisher, D., Frey, N., & Hattie, J. (2016). Visible learning for literacy, grades K-12: Implementing the practices that work best to accelerate student learning. Corwin Press.
Jakobson, B., Danielsson, K., Axelsson, M., & Uddling, J. (2018). Measuring time. Multilingual elementary school students’ meaning-making in physics. In K.-S. Tang & K. Danielsson (Eds.) Global developments in literacy research for science education (pp.167–181). London: Routledge.
Polias, J. (2016). Apprenticing students into science: Doing, talking and writing scientifically. Melbourne: Lexis Education.
Taasoobshirazi, G., & Glynn, S. M. (2009). College students solving chemistry problems: A theoretical model of expertise. Journal of Research in Science Teaching: The Official Journal of the National Association for Research in Science Teaching, 46(10), 1070-1089.
Tyler, R., Prain, V., & Hubberm P. (2018). Representation construction as a core Science disciplinary literacy. In K.-S. Tang & K. Danielsson (Eds.) Global developments in literacy research for science education (pp. 301–317). London: Routledge.
Waldrip, B., Prain, V. & Carolan, J. (2010). Using multi-modal representations to improve learning in junior secondary science. Research in Science Education, 40(1), 65–80.