Extended writing piece: A Fieldwork Report
Many geographical texts, whether in print or digital forms, are multimodal. They typically contain a combination of written text, maps, photographs, charts, diagrams and graphs. Digital multimodal texts can also include digital media like film and animation.
Geography students view and interpret multimodal texts, and they need to know how to construct them. Often, the texts they construct are in the form of fieldwork reports and presentations.
Constructing multimodal texts is a complex process that needs to begin by identifying the purpose of the writing and the audience. Writing a fieldwork report for a local government authority has a different writing style compared to creating a website to raise awareness for a geographical issue.
In addition, students need to make different choices on how to integrate evidence (Balderstone, 2006). Assigning students the task of constructing multimodal texts can be a means to "assess students' understanding of geographical concepts and processes, as well as their analytical skills and ability to communicate this understanding effectively" (Lambert & Balderstone, 2010, p.276).
Structure of fieldwork reports
A fieldwork report is a detailed account of field-based investigations. Conventionally this has been presented as a written report and now it is produced in different formats. Regardless of the format, fieldwork reports are generally written in the third person, and the present tense. There is usually a contents page or navigation menu and the report is divided into sections. The figure below is an example of a common structure of a fieldwork report.
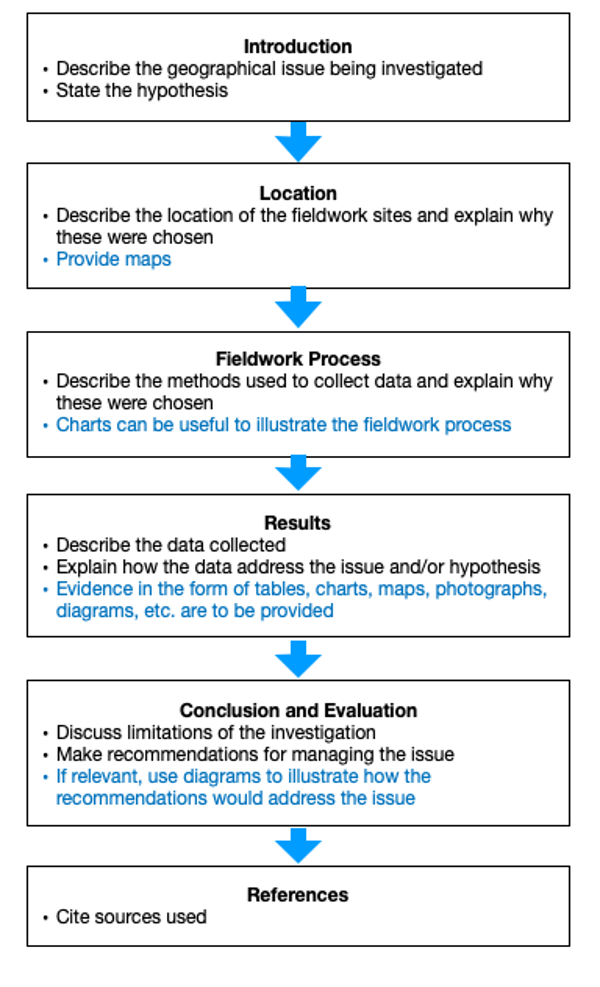
- The fieldwork report typically begins with identifying the investigation issue and/or hypothesis.
- This is followed by providing the place context of the fieldwork sites; maps are important non-text resources in this section.
- Next, the report discusses the methods of data collection; flow-charts are useful for illustrating the fieldwork processes in this section.
- The report then communicates the results or data collected. Typically the text is supported by evidence in the form of tables, charts, maps, photographs, diagrams, etc.
- This is followed by an analysis of the data in text, explaining how the data addresses the issue being investigated and/or the hypothesis.
- Finally, the report concludes by discussing the limitations of the investigation. Some reports may also include recommendations for managing the issue; diagrams can be useful to illustrate how these recommendations can address the issue.
- The report ends with a list of references citing the sources used.
Linking Text and Non-Text
This section provides some strategies for guiding students to link non-text resources with their text-based writing in fieldwork reports.
Constructing graphs
Quantitative data can be effectively communicated in the form of graphs e.g. bar graphs, line graphs, pie charts, climate graphs, ternary graphs. There are five geographic conventions (known as SALTS) for constructing a graph.
- Scale - indicate clearly the units of measurement e.g. percentage, population
- Axis - label clearly each axis, indicating what is being shown e.g. year
- Legend - explain the colours, shading, lines or symbols used on the graph
- Title - state the subject, place and year of collection of the data shown
- Source - state where the data comes from (usually this is shown below the graph)
Describing figures in reports
The following are some language features that can be used to describe the data presented in graphs and maps.
|
Noun/Verb to describe the change
|
increase, decrease
|
|
Adjective to describe pattern or trend
|
steady, sharp, gradual, moderate
|
|
Connectives to contrast data
|
however, whereas, by contrast, differs from, on the other hand
|
|
Connectives to compare data
|
similarly, likewise, in comparison, the same as
|
|
Comparative adjectives to show the degree of comparison
|
more, greater, higher
|
|
Adverbs to show frequency
|
daily, weekly, once, twice a year, sometimes, rarely
|
Linking text and non-text in fieldwork reports
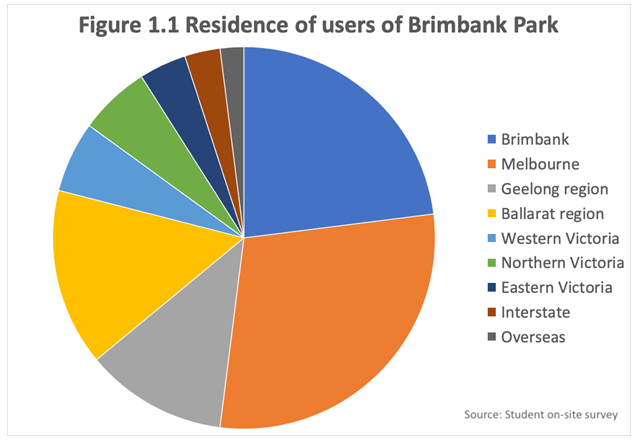
Figure 1.1 shows the residence of users of Brimbank Park. The majority of users live in Melbourne and Brimbank. The next largest proportion of users live in Ballarat and Geelong, although slightly fewer residents visit from Geelong.The data shows that users mainly reside in areas close to the park. There were few visitors from eastern Victoria, interstate and overseas.
In the above example, the student:
- uses a legend to identify the origins of the users of Brimbank Park by colour
- writes a descriptive title for the graph (‘Residence of users of Brimbank Park’)
- states the source of the data (‘Student on-site survey’)
- describing the data using:
- comparative adjectives (e.g. the majority, next largest, few) to show the degree of comparison
- adverbs (e.g. mainly) to demonstrate extent
- connectives (e.g. although) to indicate contrast in data.
Constructing and describing a map (small-scale)
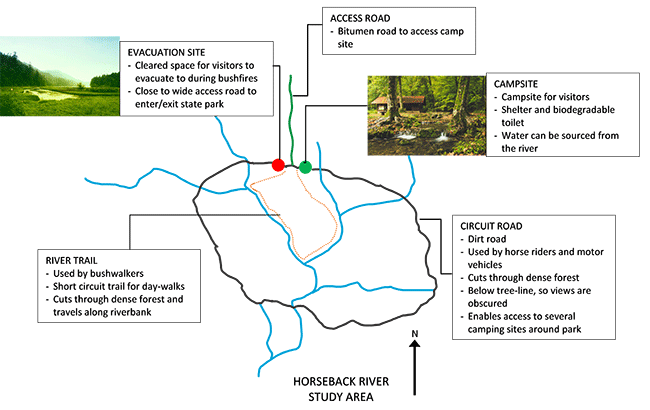
In the above example, the student:
- indicates orientation with a north arrow
- uses the title to state this is a map of the study area (‘Horseback River Study Area’)
- includes annotations to describe what the symbols drawn on the map represent e.g. the green dot is annotated as ‘Campsite’ and the dark brown line is the ‘Circuit Road’.
- includes field observations to add detail to the annotations, such as “Below tree line, so views are often obscured”
- includes photographs, where possible, as additional information for locations on the map.
Learning sequence
The learning sequence for Levels 7 and 8 in Geography, demonstrates how literacy teaching strategies can be used in a sequence.
A learning sequence tool is also available to assist in the planning of Geography and Literacy across a series of lessons.
References
Balderstone, D. (Ed.). (2006).
Secondary Geography Handbook. Sheffield, UK: Geographical Association.
Kriewaldt, J, & Digby, B. (2010).
Keys to Geography, (2nd ed.), Macmillan Education, South Yarra