The use of images and diagrams in Science are beneficial as means for generating, visualising and communicating scientific ideas (Treagust, Won & McClure, 2018).
One of the challenges of reading images is that they condense meaning, in part because individual pieces of information or ideas are no longer readily identifiable. By “unpacking” visual representations, teachers help students to make discernible pieces of information that students may not be able to identify (Fredlund et al., 2014).
To begin to unpack visual representations, teachers can ask students a series of questions, such as:
- What type of image is it: real, a photo, a diagram?
- Does it show a process? If so, how?
- Is the image annotated or animated?
- Is the image two- or three-dimensional?
- Is the image of a part, a cross-section, a whole?
- Is colour used in a purposeful way? (Polias, 2016, p. 59)
This activity supports the development of Science Inquiry Skills (VCSIS110,
VCSIS137).
Three additional strategies teachers can use to support students to answer the above questions and to develop the literate skills to read and think through visual images in science are:
- explicit teaching of the meaning-making systems of scientific images
- joint deconstruction of an image
- transforming and representing.
Literacy in Practice Video: Biology - Pedigree Charts
In this video, the teacher is using a pedigree chart to engage a Year 9 class to think scientifically about a real-world family story. This video was recorded in a single lesson and begins with the teacher reading a family story. Students then use the family story to build meaningful links between vocabulary, concepts and symbolic representation used in the pedigree analysis.
These teaching notes support the video that shows a teacher using a pedigree chart to engage a Year 9 class to think scientifically about a real-world family story. The example text is available here.
Explicitly teaching the meaning-making systems of scientific images
Within each of these meaning-making systems, different symbols are read differently to convey meaning. For example, the meaning of an arrow in a written chemical equation is different to the meaning of arrows in a change of state diagram. Students need to be taught the meaning of symbols that are commonly used in scientific visual representations. The ability to read and understand what a symbol means is a form of
decoding.
To assist students to develop the literate skills to decode visual representations in Science, teachers should first explicitly teach the meaning of common symbols and structures that are used in scientific visual representations. These include:
- the difference between arrows and lines
- the importance of colour
- the organisation of phases. (e.g. reading left to right, or clockwise)
- the function of captions and labels.
Deconstruction of an image
Another way to teach students how to read images in Science is through deconstruction. Deconstruction, also known as modelling, is a form of explicit teaching (HITS Strategy 3). Teachers can jointly deconstruct an image or process with students to model the literate skills and thinking that is used by scientists to read visual representations.
To jointly deconstruct a diagram in Year 9 or 10 (VCSSU130):
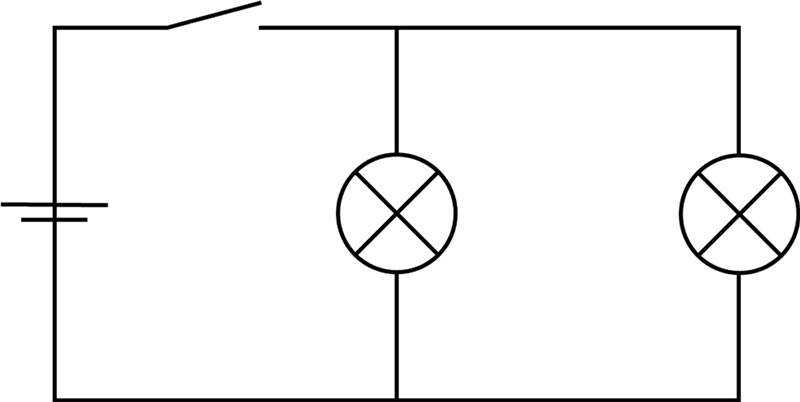
- The teacher presents a diagram to the class (for example, circuit diagram).
- The teacher asks students to offer an interpretation or explanation of the diagram (e.g. “What is this image showing you?”, “How do you know?”, “What does this part of the image mean?", “What does this symbol mean?”).
- The teacher adds to, or corrects, the students’ interpretations, modelling how to apply scientific understanding to interpret and read the image. At this stage, the teacher talks through her/his thinking.
- The teacher checks for student understanding during the joint deconstruction and at the end of the session.
Students may also be encouraged to annotate the diagram as they read, speak and think through it.
Literacy in Practice Video: Physics - Visual Representations
In this video a teacher challenges a Year 10 class to develop a symbolic representation of a real electrical circuit. This video was recorded in a single lesson and begins with the teacher identifying the components of a real electrical circuit. Students are then guided to use symbolic representation to draw a circuit diagram.
Read the
in-depth notes for this video.
A similar process can be applied to reading texts. For example, teachers may select a passage of written text and jointly deconstruct it with a class or in small groups. This activity is also known as close reading.
References
Evans, B.P., & Shively, C.T. (2019). Using the Cornell note-taking system can help eighth grade students alleviate the impact of interruptions while reading at home. Journal of Inquiry & Action in Education, 10(1), 1–35.
Fredlund, T., Linder, C., Airey., J. & Linder, A. (2014). Unpacking physics representations: Towards an appreciation of disciplinary affordance. Physical Review Special Topics, Physics Education Research, 10(2), 020129-1–020129-13.
Pauk, W., & Owens, R.J.Q. (2010). How to study in college. 10th ed. Boston: Wadworth/Cengage Learning.
Polias, J. (2016). Apprenticing students into science: Doing, talking and writing scientifically. Melbourne: Lexis Education.M
Treagust, D.F., Won, M., & McClure, F. (2018). Multiple representations and students’ conceptual change in science. In G. Amin and O. Levrini (Eds.), Converging perspectives on conceptual change (pp. 121 – 128). New York: Routledge.