Just as students can draw graphical representations to show their reasoning or solutions, students can also be taught to discuss and critique graphical representations.
For example, to produce accurate function graphs from worded problems, students need to be able to interpret worded and symbolic information. This includes reading a graph to check that all given information in a worded problem is accurately represented.
Having students discuss and critique visual texts aligns with the code-breaking and meaning making aspects of
the four resources model for reading and viewing (Quinnell 2014).
To support students to develop the ability to read function graphs and determine if they represent all information in a problem, teachers can provide opportunities for students to discuss and critique options for graphs. In this case, students are interpreting text, rather than producing text.
Understanding this strategy
Teachers can:
- Provide students with a worded problem and some graphs.
- Ask students to discuss whether each graph satisfies the conditions given in the problem.
- Remind students they should focus on interpreting written language (labels, titles) as well as graphical features (scale, intercepts, shape of a graph) to determine whether the graph is accurate.
When introducing this activity, students may be given a checklist of these features to help scaffold their interpretations.
Example using critique of graphical representations
The following example shows how this strategy can be used in a Year 8 class on the topic linear graphs (VCMNA283).
Problem
A plumber charges a $80 callout fee and $20 for every ten minutes of work. The cost for the plumber can be approximated by a linear function.
Discuss each of the following graphs and determine which graph best shows the plumber's fees.
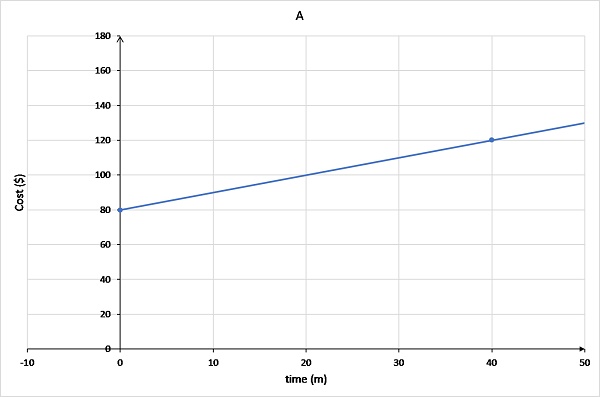 Graph A has the line originating at (0,80) and passing through (40,120).
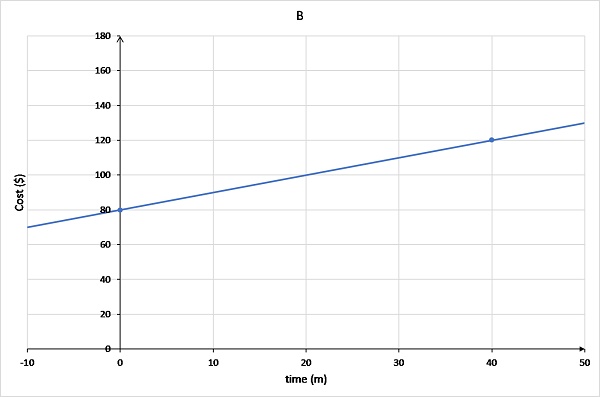 Graph B has the line extending into negative x values and passing through (0,80) and (40,120).
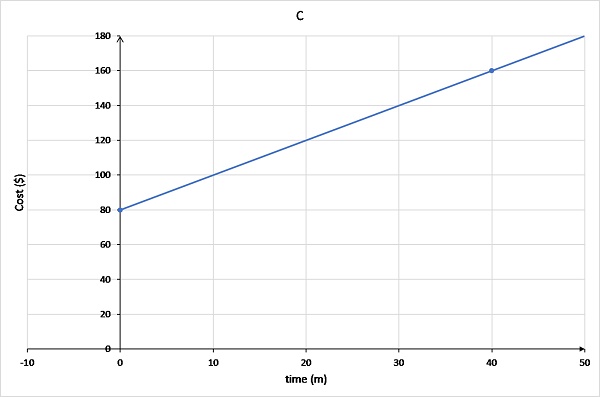 Graph C has the line originating at (0,80) and passing through (40,160).
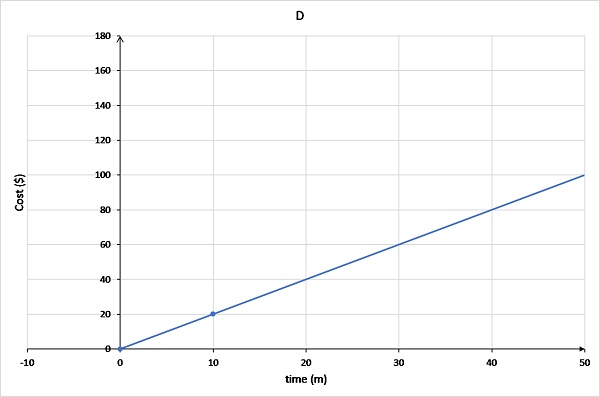 Graph D has the line originating at (0,0) and passing through (10,20).
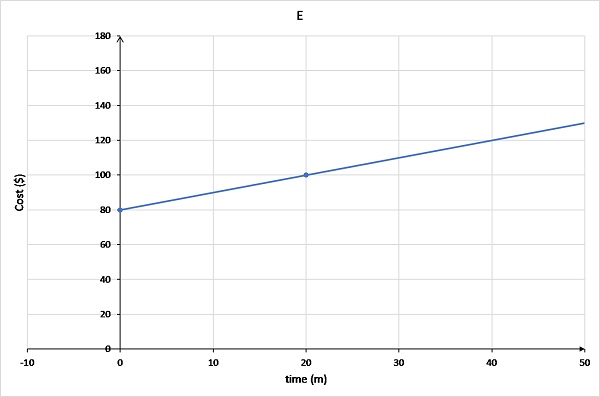 Graph E has the line originating at (0,80) and passing through (20,100).
Possible student thinking
The problem relates time to cost. Because cost is calculated based on how much time the plumber works, cost should be on the vertical axis. This means time is on the horizontal axis.
The call out fee is $80. This means that when time = 0, cost = $80. This occurs only for graphs 1, 2 and 3.
Cost increases at $20 for every 10 min. So at:
- t = 10, C = 80 + 20 = $100
- t = 20, C = 80 + 40 = $120
- t = 30, C = 80 + 60 = $140
- t = 40, C = 80 + 80 = $160
Cost can not be negative, so it can't be graph B.
Solution
Graph C best represents this. The line starts at (0, 80) and goes up 20 for every 10 min (or gradient is 20).