In Economics and Business, the combination of various textual modes, such as diagrams, graphs and symbols, provides students with a multitude of potential ways to represent their current understanding (Lemke, 2002).
Having students create their own visual representations can be beneficial as it provides an easy-to-process structure to retrieve, and show, their knowledge (Vekiri, 2002). This is particularly useful in Economics and Business to enable students to represent their understanding of concepts and the relationships between them. Without such structures, it can be challenging for students to comprehend, retain and communicate new knowledge.
Two strategies to support students to draw visual representations of their Economic and Business knowledge are:
- using shorthand notation to show economic relationships
- using graphic organisers to demonstrate economic understanding.
Using shorthand notation to show economic relationships
Shorthand notation can be used to translate and communicate economic understanding using symbols and abbreviations to illustrate:
- specific economic terms
- the relationships between these terms
- the impact of these relationships.
Loughran (2010, p. 105) suggests that translating information and ideas from one form to another allows students to demonstrate a deeper understanding of what they have learned because they need to manipulate what they know about a given idea, concept or issue and present it differently.
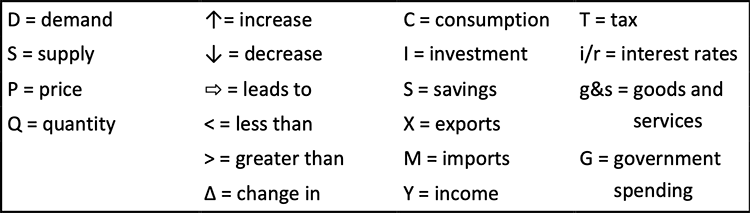
- Introduce students to letters and symbols used in economic shorthand and what they represent. For example:
- Write an economic situation/problem/issue on the board for students to respond to. For example:
- 'Explain what might happen to the economy if the average income of Australians increased.'
- Instruct students to read the economic situation/problem/issue on the board and ask any questions about what they might have in relation to it.
- Provide support to students by starting the explanation in economic notation for students.
- For example:

- Students work in pairs to complete their response using economic notation.
- Responses from one or more pairs of students are shared with the class and written on the board.
- For example:

- The teacher makes any edits to the response if misconceptions are evident and students are instructed to edit their responses.
- The response using economic notation can then be translated into a written response, so students have both versions of the response recorded. For example:
- If income increases, this will lead to an increase in demand for goods and services, which will lead to an increase in supply.
Curriculum links for this example are:
VCEBR011,
VCEBR021.
Using graphic organisers to demonstrate economic understanding
Graphic organisers can be a visual representation of information in a text. They are a type of advance organiser that that can show patterns within, and between, concepts (Manoli & Papadopoulou, 2012) whether this is by:
- comparing and contrasting similarities and differences
- showing hierarchical relationships
- demonstrating relationships.
In Economics and Business, students consider relationships between and interdependence of groups such as:
- consumers
- workers
- producers
- the Australian economy in relation to the Asia region and the global economy.
One example of a graphic organiser is a Fishbone Diagram that illustrates cause and effect relationships, which is outlined below.
Fishbone diagram
- Teacher presents an intended outcome for the group.
- For example: "A successful business".
- Arrange students into small collaborative groups with large sheets of paper and some Post-It notes for students to be able to list possible causes for the intended outcome. Students can move the Post-it notes around as they develop their diagram.
- Alternatively, the teacher could present a report or paper about successful businesses, which students can read (or the teacher could use
shared and modelled reading) to assist students to identify possible causes for creating a successful business.
- Instruct students to write the effect at the end of the head of the arrow on the central spine of the diagram.
- In this case, it is "A successful business". A completed Fishbone Diagram for this activity is below.
- Discuss with students how to categorise the causes leading to the effect described.
- Instruct students to write the names of the categories in
green boxes that are attached to the arrow pointing to the central spine of the diagram. The number of categories can be more or less than the four categories that are shown in the example below.
- Instruct students to work in groups to brainstorm different causes related to each of the listed categories. These should be written on branches that come from the arrows that each category is attached to.
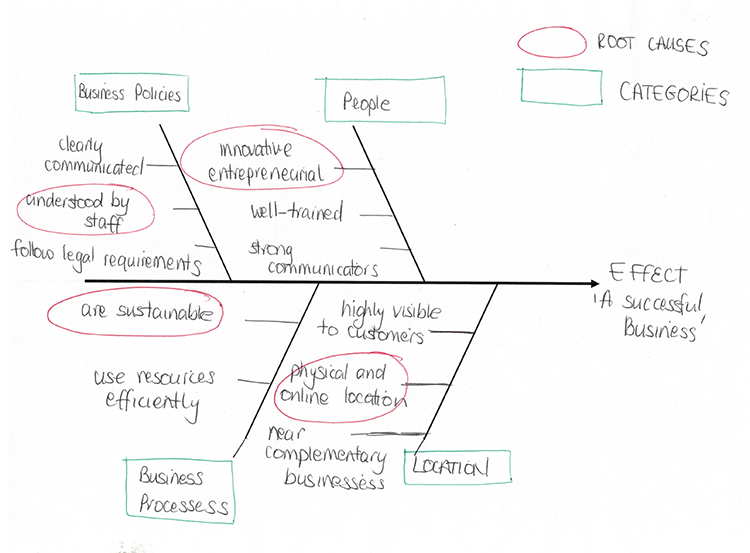
- Once students have completed the diagram, filling in all the causes that they can think of for each category, instruct them to circle the top 3 root causes contributing to the intended effect.
- You might wish to use the '5 Why' approach at this stage by asking students a series of 'Why' questions to encourage students to justify why they believe the root causes that they have identified are the primary reasons for the effect described.
Examples of the 5 Why questions and possible student responses are
- Why do you think that innovative and entrepreneurial characteristics are more important to a business' success than communication skills?
- You need a novel product or service to sell and promote first.
- Why might sustainability in business processes be important for a business' stakeholders and how might this lead to its success?
- People are now more concerned about the environment and climate change, so sustainability can be a selling point.
- Why do businesses benefit from a physical and online location and do they need both to be successful?
- More people are searching for and buying things online, so an online presence is important. It also means you can sell things overseas.
- Why it is important for all staff to understand the business' policies and what are the consequences to the business if they do not?
- You want all of your staff to understand how the business works. This will mean that all of your customers will get the same treatment. You want your customers to be happy and all be treated the same.
- Why do you think that using resources efficiently in business processes is less significant as a cause than having sustainable business processes?
- Sustainable processes are more than just using resources efficiently. You can use resources efficiently but not be all that sustainable.
Curriculum link for this example is:
VCEBB015.