Teaching context - Investigate, interpret and analyse graphs from real life data
Students use graphs to investigate and interpret real life data such as using travel graphs to investigate distances travelled or temperature graphs to compare weather at different times.
As graphs are commonly used in everyday life is it a useful skill that students can interpret the information displayed on a graph accurately. When interpreting graphs students will focus on different features such as the slope of the lines and the meaning of horizontal lines.
Students will also consider appropriate domain and range restrictions depending on the scenario presented (for example, rainfall measured in millimetres cannot be negative, therefore the axes showing rainfall would only be drawn with positive integers).
At this level students may be analysing real life data graphs for the first time. Showing lots of examples and discussing what is happening at each stage of the graph helps students to see what elements of the graph they should focus on.
Discussing aspects of the graphs such as the positive and negative slopes of the lines, meaning of horizontal lines or where the points are situated helps students to break down a graph into smaller manageable parts.
Rather than asking 'What does this graph show?', ask students what does the graph show between parts A and B and talk about each section of the graph individually to help students create a story of what the graph shows.
Students may have difficulty understanding that a travel graph shows a relationship between distance and time and is not simply a 'picture' of what happened. For example, the graph shown displays a person's distance from home in kilometres versus time in hours.
Students may mistake the graph for showing that the person walked up a hill, waited for an hour and then walked back down. Drawing student's attention to the axes and units of measurement when they first begin to analyse a graph is recommended. This can be done by using a prompting question such as 'What does the vertical axis tell us?' or 'What does the origin represent in this scenario?
Teaching idea - Breaking it down into parts
Find a real-life graph (travel graph, temperature graph etc.) that has at least three different sections to be discussed. Share this graph with the whole class.
Extension idea
High-ability students could be provided with a graph with more than three sections. For example, using a time-distance graph. Begin with prompting questions about the axes.
- What does the vertical axis tell us? What does the horizontal axis tell us?
- What does the origin represent in this scenario?
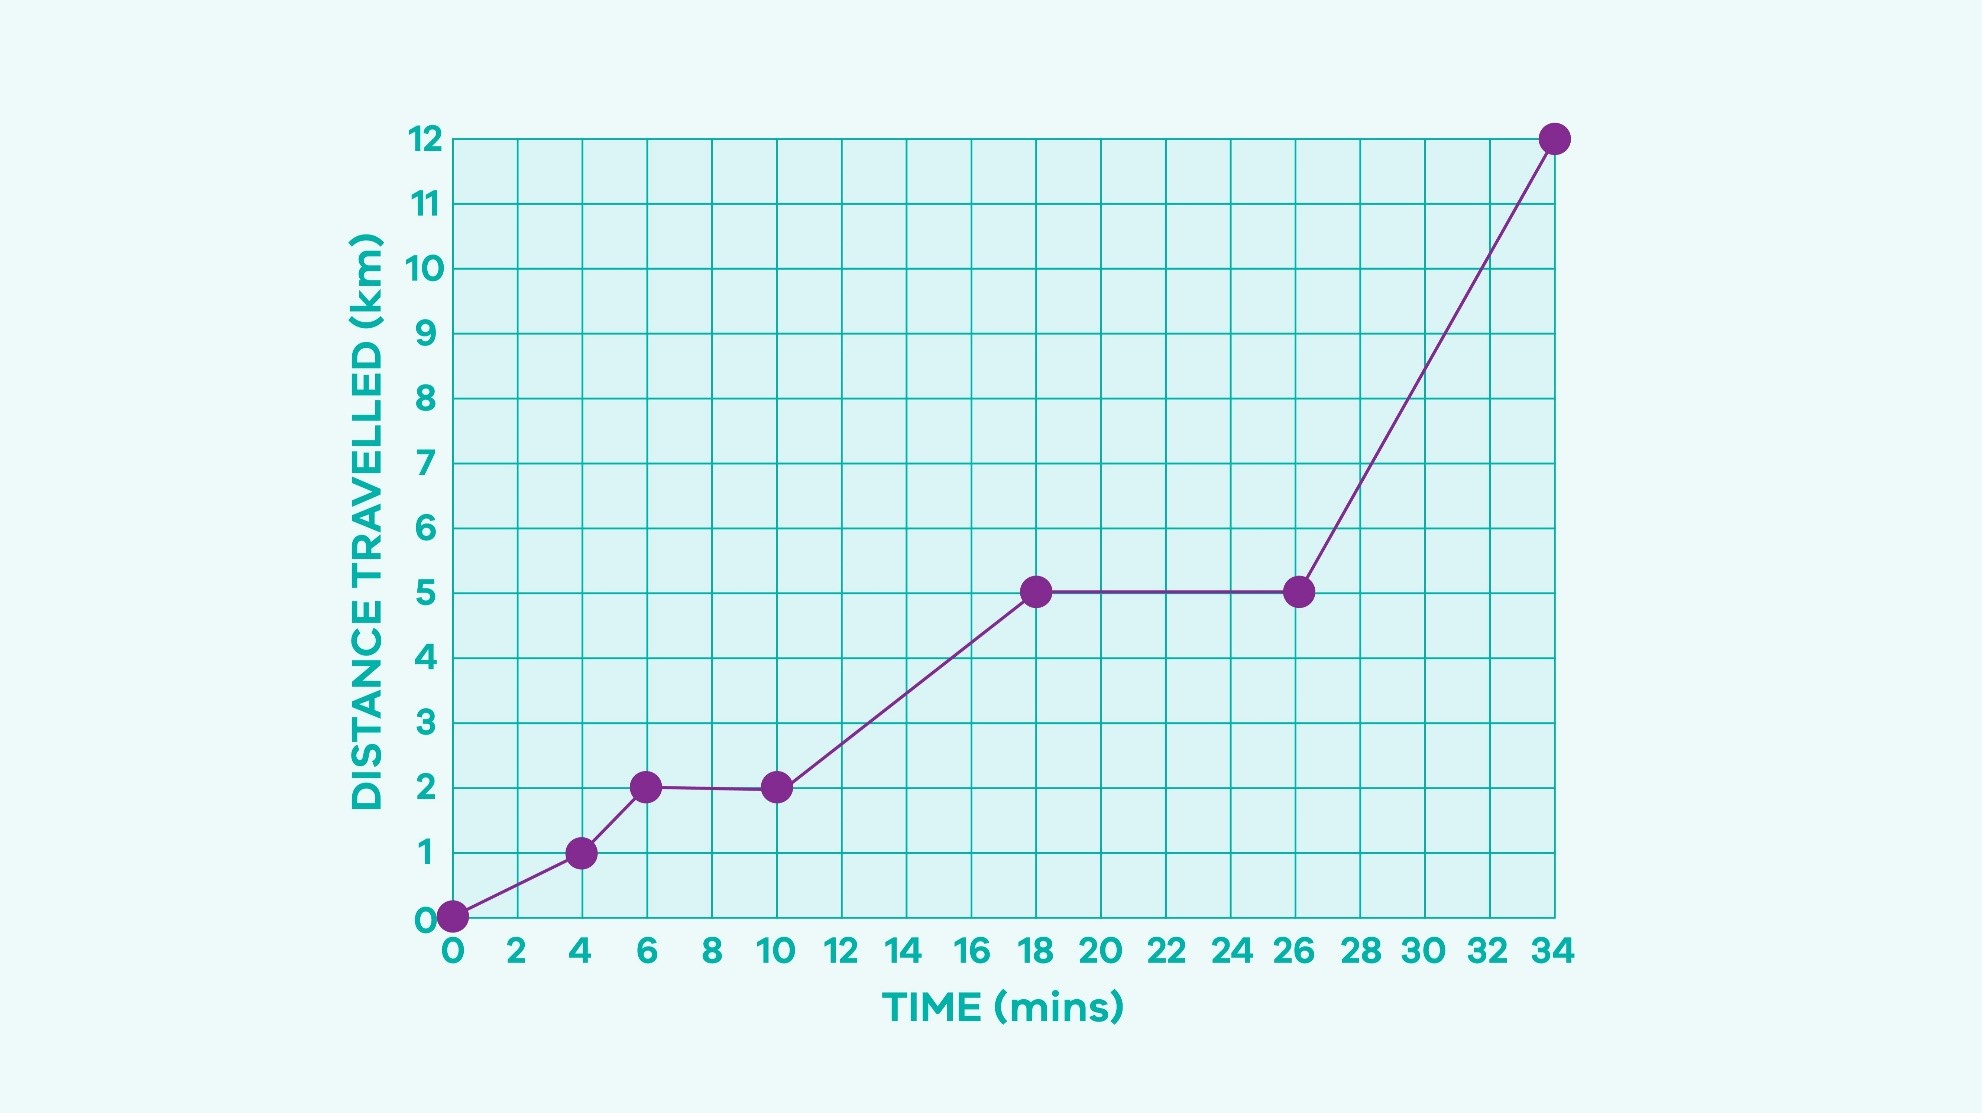
These types of questions help students to focus on what the particular graph is showing. Discuss what each section of the graph represents. For example: From the start to A, the person has travelled one kilometre in four minutes. From B to C the person has remained stationary for four minutes and so on.
If the students can identify what each section of the graph represents, start discussing what the different slopes mean, the horizontal sections, how many kilometres from the starting point is the person and 'unpack' the graph further.
Students then apply these skills individually on another graph.
Further extension ideas
- Pre-test students on their graphing knowledge so high-ability students can have their curriculum compacted and extended.
- High-ability students could be:
- invited to predict what might happen if the graphs features were altered. For example, what would happen to the slope of the graph if time is represented at 1 minute intervals? What would happen if the time was represented in 5 minute intervals?
- asked to consider when n it would be useful to use larger intervals.
These strategies will ensure high-ability students are using their higher order thinking skills by through making predictions and transferring knowledge and skills to new situations.
Original lesson plan available on the Maths Curriculum Companion