For many years we have been reading about gender differences in mathematics learning. And for many years, too, we have asked what we, teachers, parents, and educational bodies, can do to ensure that girls are not left behind. Sadly, we have to accept that after at least five decades of serious research, hard work, and good intentions, subtle but persistent gender differences continue to be observed and described. Further research and actions are clearly needed.
Performance
The consistency of the findings is startling. In each year, and at each grade level, over the past decade boys have, on average, slightly outperformed girls. But the overall picture is more complicated.
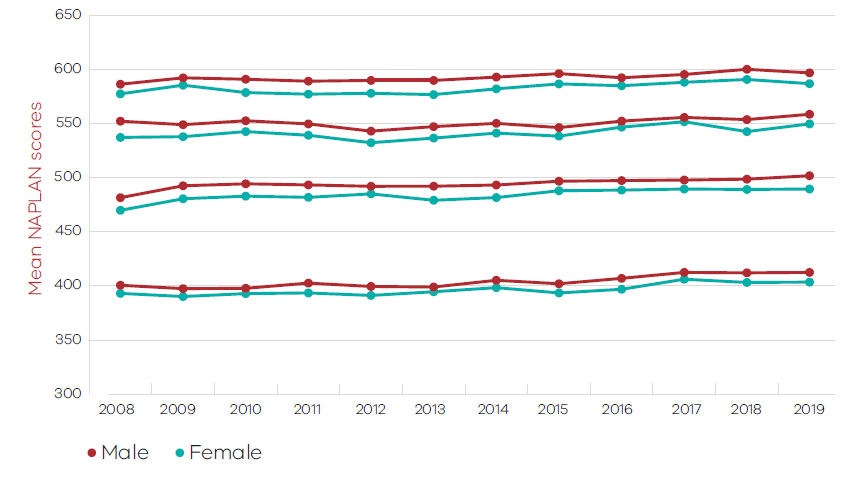 NAPLAN results Year 3, 5, 7, and 9 by gender 2008-2019
For each year, this graph illustrates that boys, on average, slightly outperform girls for each at Year 3, 5, 7 and 9. It is often reported in the literature that, on average, boys outperform girls in mathematics. Is this true in Australia? Let’s look at the Numeracy component of the nationally mandated NAPLAN tests.
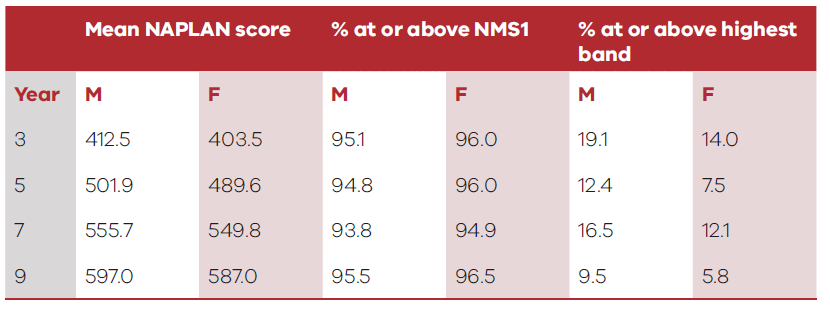 Table 1. NAPLAN Numeracy data for 2019 by gender (National Minimum Standard)
Table 1. Long description
This table provides data, organised into three sets of columns, titled Mean NAPLAN score, % at or above National Minimum Standard, and % at or above highest band. Each of these columns are further segmented into sub columns for Male and Female. Measurements are made for Years 3,5,7, and 9. Achievement shows that males slightly outperform females at all year levels, females achieve slightly higher % above minimum standard across all year levels, but males significantly score higher at or above the highest NAPLAN in all year levels.
Consider further results from the NAPLAN Numeracy test – see the entries for 2019 in Table 1.
It can be seen that:
- A slightly higher proportion of girls than boys met the National Minimum Standard.
- A higher proportion of boys than girls scored in the highest band.
Importantly, for high achieving students, similar findings have been reported on this test in previous years and also for test data gathered in other countries.
Participation
What about participation in mathematics subjects beyond the compulsory years of mathematics?
For this it is useful to look at Victorian data for the three VCE mathematics subjects. Findings for almost two decades, from 2001 to 2019, are summarised in the graphs below.
Although in 2018 and 2019 the category X was included among the self-identification categories, the small number of students who so identified are not included in the graphs.
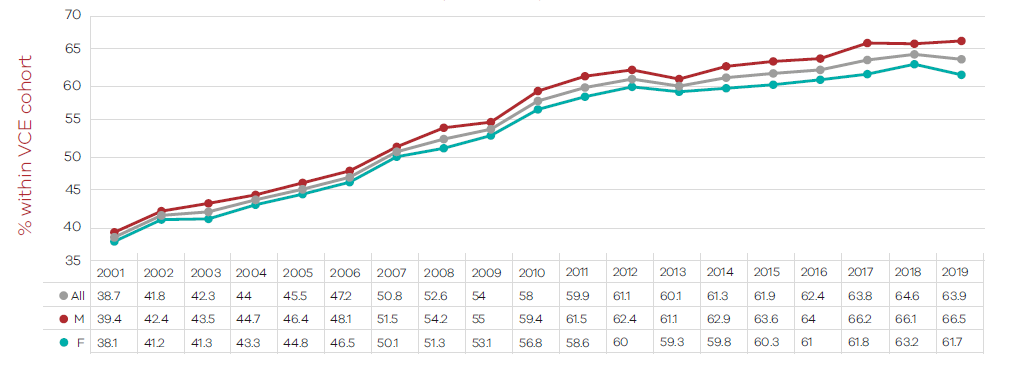 VCE Further Mathematics Enrolments (2001-2019)
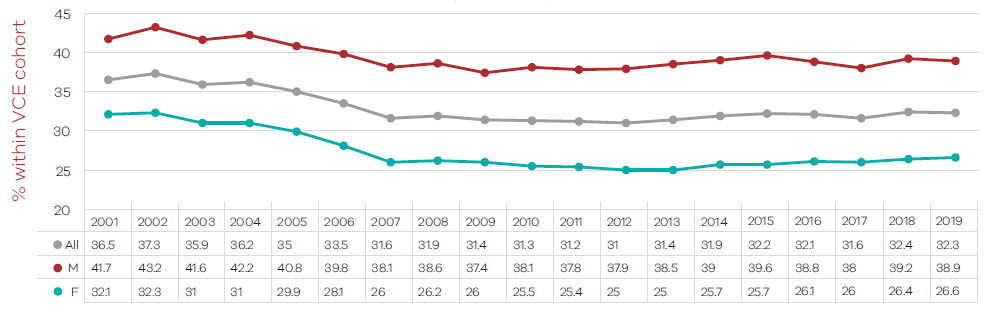 VCE Mathematical Methods Enrolments (2001-2019)
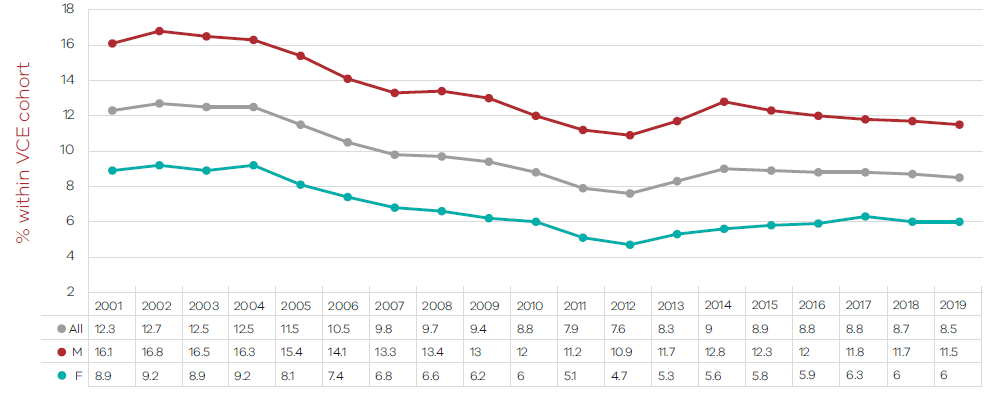 VCE Specialist Mathematics Enrolments (2001-2019)
For each year (2001–2019), and for each of the subjects, proportionally more boys than girls have been enrolled in the three VCE mathematics subjects.
Similar findings for enrolments in post compulsory mathematics subjects are reported in many other countries.