The Goompi model can be used by teachers to connect mathematics and culture. The model ensures that students experience mathematics that is part of their living world and a part of who they are.
Teaching mathematics from a cultural perspective
My first mathematics education project was at Dunwich State School on Minjerribah (Stradbroke Island), Queensland. For this project, I wanted to explore how to improve the teaching and learning of mathematics for Indigenous students that support their cultural identity. To do this, I had to develop an understanding of mathematics and its connection to culture.
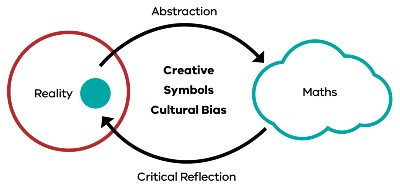 Figure 2: The Goompi Modle: teaching mathematics from a cultural perspective.
Figure 2, The Goompi Model, represents a cycle that shows the development of mathematics over time. There are three key concepts from Figure 2 that connect mathematics and reality through the lens of creative, symbolic and cultural bias.
As illustrated in Figure 2, mathematics is about reflecting on the world around us and identifying a part of our reality (blue circle) we want to understand. We then naturally go through an abstraction process (top arrow) where we create multiple representations (i.e. language, symbols, drawings, stories and so on) of concepts and processes we are interested in.
These abstract representations become part of a body of knowledge that we call mathematics (the cloud) and allows us to explore the world in abstract form to gain further insights. Given that mathematics has been created by people, we must then critically reflect (bottom arrow) on the mathematical constructs to ensure that we have represented concepts and processes accurately.
Figure 2 forms a cycle that can be interpreted as an evolutionary cycle that has driven the development of mathematics over time. There are three key concepts from Figure 2 that highlight the connection between mathematics and culture: creative, symbols and cultural bias.
When I first reflected on this process in Figure 2, it was evident that the process fits many different cultural expressions. My first thought was art, which then implied that mathematics could be taught through creativity and a creativity that goes beyond creative thinking. I was keenly interested in whether we could teach mathematics through creativity that allows self-expression i.e. the students can express their ideas using their language and their way they see the world while learning key mathematical concepts. In essence, students express their culture as part of the teaching and learning of mathematics.
Symbols are fundamental to the process in Figure 2 since symbols carry meaning from our reality into the abstract world of mathematics. In mathematics education, I would argue that we do not teach enough about the meaning of symbols, the connection between multiple symbols and how they connect to mathematical concepts and concepts from reality. Another inherent aspect of Figure 2 is cultural bias.
Cultural bias can often be perceived as a negative, but I would argue that it is a natural consequence of any abstraction whether it be art, music or mathematics. In addition, mathematics has been created, translated and interpreted by many cultures around the world. If we recognise the cultural diversity of mathematics, it provides an opportunity to see mathematics from different perspectives and consequently see different ways to teach mathematics and create innovative pedagogy.
As part of this project, I created the model in Figure 2. The model is called the Goompi Model because it is the traditional name of the Country Dunwich State School resides. The name keeps the connection back to Country: its place of origin. It is also about keeping all the connections alive that are represented in the model to ensure that students experience mathematics that is part of their living world and part of who they are.
Exemplar: Teaching linear equations using growing patterns
To demonstrate the used of the Goompi Model, this section will focus on the teaching and learning of linear equations. Even though linear equations are usually taught in high school, I would encourage all teachers to continue reading to get an understanding of how the Goompi Model can transform the teaching of mathematics and the potential outcomes this approach could have for students’ learning. This exemplar will focus on creativity as self-expression and the potential this has to increase students’ conceptual understanding of mathematical concepts.
For most students, their first introduction to linear equations is given by the following generalised equation:
y=mx+c
Where y is the dependent variable, x is the independent variable and both m and c are constants. This type of highly abstract introduction to any mathematical concept would make most students wish they could run out the door.
This problem has been recognised in mathematics education for a long time and, for linear equations, the pedagogical approach called growing patterns has been used to soften the abstraction blow and give some purpose to the study.
Typical representation of a growing pattern
Figure 3 shows a typical representation of a growing pattern that is used to introduce linear equations to students. The basic process for growing patterns is for students to 1) translate the pattern into a number sequence i.e. count the number of squares at each stage; and 2) transform the number sequence into a linear equation. The first step is straight forward but, in the second step, it is not always self-evident how you can create a linear equation from the number sequence. It becomes another cognitive jump that students need to navigate.
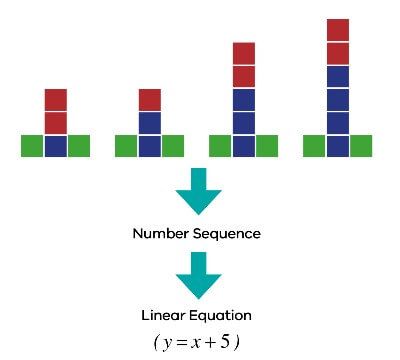 Figure 3: Typical representation of a growing pattern
Figure 3: Long description
This is a visual representation of a number sequence by showing growing pattern of four T shaped block patterns. The initial t shape consists of five blocks, the base layer consisting of a green block, blue block, and a green block. Immediately above the blue block there are a stack of two red blocks.
In the next shape, consisting of 6 block, another blue block is placed onto blue block, and on top of the blue blocks there is two red blocks.
In the third shape, the growing pattern is represented by 7 blocks with another blue block added to the tower of blue block.
The fourth t shape the block pattern now contains eight blocks, is represented by a green block, a stack consisting of four blue blocks and two red blocks, and then a green block.
This number sequence is then expressed algebraically in a linear equation- y= x+5.
Some of the positives of this approach is that teachers can uses these patterns as an open ended question for the students to investigate, which can lead to students’ understanding the different ways to perceive the growing pattern and how they relate to a linear equation.
However, by using the Goompi Model, we can create a pedagogical approach that shifts the effort from negotiating a cognitive jump to focusing on the main mathematical concepts underpinning linear equations. This allows students to create their own representation of a linear equation from their world view.
Goompi model version of growing patterns
The following will give a brief account of the Goompi Model version of growing patterns focusing on a few key steps. I will then provide an example of a student’s representation of a growing pattern to demonstrate the importance of creativity, as self-expression, in the teaching and learning of mathematics.
First stage of growing pattern pedagogy using the Goompi model
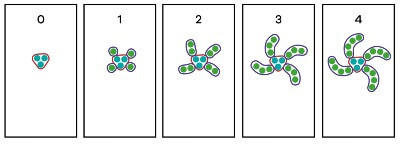 Figure 4: First stage of growing pattern pedagogy using the Goompi Model
Figure
4: Long description
This diagram shows a growing pattern drawn on five pieces of butcher’s paper. The first piece of paper, representing day 0 illustrates a free-form red square containing three blue dots.
The pattern grows as shown on the next piece of paper, day 1. On this piece of paper, there is the same squarish shape as day 0, but now includes a green dot on each corner.
On the next piece of paper, the pattern grows with an additional green dot added to each of the green dots, starting to form a spiral shape now with two dots.
On the fourth piece of paper, a further green dot is added, with the diagram showing four arm shapes each containing three green dots.
The final diagram now looks like a swirling, spiral diagram, with the centre of 3 blue dots, and four swirling shaped arms, each containing four green dots.
In this version of growing patterns, the first main step is to explicitly teach the connection between the structure of a pattern and the structure of the linear equation. This process starts with a series of butchers paper on the ground (5 is a good number) with each paper representing a different day. I tell a story about observing a pattern growing over several days and draw each stage of the pattern on the butchers paper. As I’m drawing the pattern, I ask the students if they recognise the pattern.
Given that I’m drawing a spiral, students start to connect this pattern with hurricanes, galaxies, flowers and so on. I then tell the student that there are two processes in my pattern, that is, there is a part that stays the same and a part that is growing. To reinforce this understanding, I ask for a volunteer to circle the part that “stays the same” and the part that is “growing” and colour code these as red and blue respectively. This is represented in Figure 4 with the pattern growing over four days.
Second stage of growing pattern pedagogy using the Goompi model
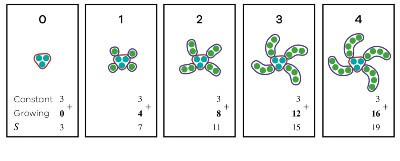 Figure 5: Second stage of growing pattern pedagogy using the Goompi Model
Figure
5: Long description
Figure 5 contains the same pictures as Figure 4, but with the additional information that provides a mathematical abstraction of the story.The Constant is represented by blue dots and for each of Day 1 to Day 4 , and Growing part represents the number of dots on each corner.
On the first piece of paper, representing Day 0, the Constant is 3, and the Growing part is 0 making the total value, represented by S equal to 3.
On the next page, the Constant is three and the Growing part is 4 providing a total S equal to 7.
On Day 2, the Constant is 3, the Growing part is 8 bringing the total to 11. For the fourth piece of paper, the Constant is 3, each arm contributing three dots, bringing the Growing part to 12 for a total S of 15.
The final piece of paper shows that the total is 19, built by the Growing part of 16 and the Constant being 3.
The next stage is to use numbers to emphasise the structure of the pattern. I pose the question to the students, “How big will my pattern be in a year i.e. 365 days?” This is a common question in growing patterns but I emphasise here that we need to have a measure for the size of my spiral and we need to build a relationship between the size of my spiral and the number of days.
I define that the size of my spiral will be the number of dots in the pattern and then get the students to tell me, for each day, how many dots are in the “growing” part and how many are in the “stays the same” part. At this point, I also introduce the mathematics language for “stays the same” which is “constant”.
Figure 5 shows the series of numbers for each day and, at this point, the students get a strong understanding that three dots are constant across all the days and the growing part is increasing by four each day.
Third stage of growing pattern pedagogy using the Goompi model
The next stage of this process is to build relationship between the size of the spiral and time (or days). Figure 5 has started the relationship building by recognising that the size of the spiral is equal to the growing and constant parts added together and I define the letter “S” to represent the size of the spiral. I discuss with the students that building a relationship directly with “days” and the size of the spiral “S” is difficult but we can explore the relationship between each separate part since they make up the spiral. We then talk through the relationship between “days” and the “constant” part drawing out the conclusion that no matter which day it is the “constant” part will always be 3.
We then explore the relationship between days and the growing part. Students already recognise that the pattern is increasing by four each day but when we write out together the groups as multiplies of four, we soon realise the number of groups of four is related to the number of days. This is represented in Figure 6 which illustrates a multiplicative relationship that is expressed as an equation, including the Constant (3), and the variable (d) for the four Growing parts, helping to derive the linear equation S= 4Xd + 3.
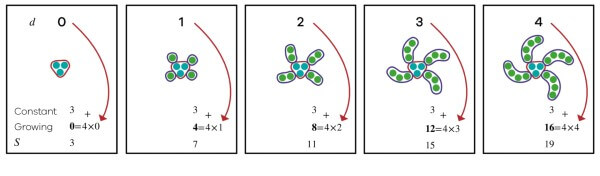 Figure 6: Third stage of growing pattern pedagogy using the Goompi Model
Note that I also introduce the idea of variables to the students as a symbol that holds a concept like time or the size of the spiral. From explicitly showing days with the “growing” part with the red arrow, we can then build the linear equation as S=4×d + 3 and reinforce that the linear equation is made up of a growing part (4 × d ) plus a constant part (3) that stays the same across all days.
I then give students a different linear equation, which is usually S=5×d + 2 and ask the students to draw a pattern for the equation.
Vignette
Roma Mitchell Secondary College, Adelaide, South Australia
Amanda Pedder is a mathematics teacher from Roma Mitchell Secondary College. Amanda attended a workshop where I demonstrated the above pedagogy to teach linear equations and decided to try the idea on a class of disengaged Year 10 students. After the lesson, Amanda was astonished that the class wanted to engage in the activity (i.e. draw pictures), she was amazed at what they drew and she had never experienced this level of conceptual understanding before from any student.
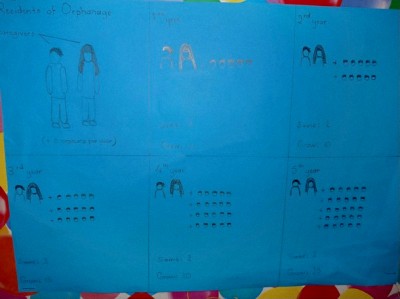 Figure 7: A student’s expression of a linear equation connected to their foster care experience
To demonstrate this, Figure 7 shows a drawing from one of the students who connected their growing pattern with their foster care experience. The student’s story behind his expression is that there are two caregivers who cared for and impacted the lives of five children each year. It is clear that the student understands the meaning of linear equations and how a growing pattern can be constructed for a given equation.
More importantly, the student also connected, on a personal level, and wanted to share part of their life with the class and the teacher. Amanda also found that this process of creativity helped disrupt the cycle of disengagement in the class and improved her relationship with the students.
Activity 3
Reflect on your culture, your world view and draw a growing pattern that represents the linear equation.
S=5×d+2